
Best Forex Candlestick Patterns to Trade
Candlestick patterns are powerful indicators that alerts you for major price movements in forex and all types of trading. They form a very strong aspect of technical analysis and produce accurate results if mastered, perfect for learning forex trading for beginners. If you don have time to trade you can check our SIGNALS PACKAGES HERE.
Whether it’s a continuation or a reversal signal, this series of patterns can easily give you a heads up about what might be coming soon.
The beauty of candlestick chart patterns is that anyone can use them – beginners and professionals.
It’s important to also note that these forex candlestick patterns can be composite with other trading strategies, price action signals, or trading indicators.
When combined, it can make a powerful strategy.
The goal of this guide is to be the last destination you’ll need when it comes to learning the candlestick pattern basics.
After reading this, you will be able to accurately identify these candlesticks in the markets correctly and able to know whether the market is giving you a bullish, bearish, or a continuation signal to enter and bank some pips.
Not only that, but you’ll also understand exactly why these patterns occur in terms of orders and momentum changes – understanding this factor can help build a bigger picture of your trading ideas!
So, let’s go through the major candlestick chart patterns and how to use them as effectively as possible.
Before we dive into each pattern, let’s go through some of the basics and build up a foundation – making life and learning easier as we progress, shall we?
Let’s start with:
Candlestick Patterns & Why Do We Use Them?
Candlestick charts, Japanese candlestick patterns, Japanese chart patterns, and similar terms are all the same.
Forex Candlestick patterns are specific formations that indicate whether a move is going to continue or reverse.
Allows traders to place trades based on their meanings.
The patterns are formed based on what the market is doing at the previous trading session.
The design of the Japanese candlestick patterns, they show a high, open, close, low with the difference between the open and close filled in with a body.
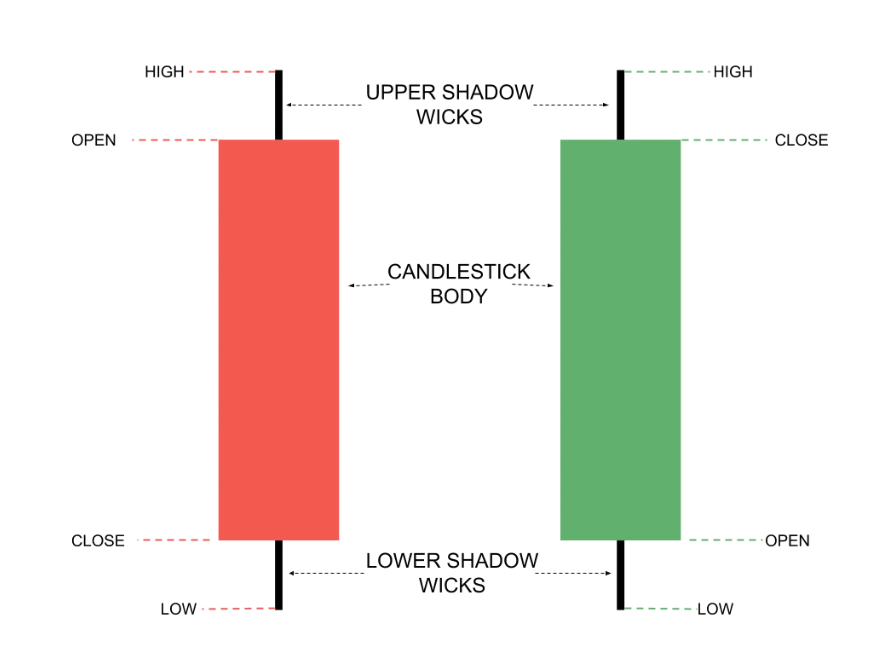
They are pretty easy to read and at a single glance can give you all the price information you need to make a trading decision.
The core reason why the Japanese candlestick is a popular choice for traders is because of this:
Easy to see whether the buyers or sellers won and by how much.
Are there many Forex candlestick patterns?
Many different combinations available.
Single, double, triple, and quadruple types of candlestick patterns + more that aren’t as well known.
We will show you 21 of the best forex candlestick patterns to learn.
- Hammer
- Bullish / Bearish Engulfing
- Piercing line
- Morning doji star
- Three white soldiers
- Shooting star
- Evening doji star
- Three black crows
- Dragonfly Doji
- Gravestone Doji
- Tweezer top/bottom
- Falling three methods
- Rising three methods
- Three line strike
- Three black crows
- Bullish/Bearish Harami
- Bullish/Bearish Hikkake
This will be enough forex candlestick patterns for your trading career. You can also be interested in our SUPPORT AND RESISTANCE INDICATOR.
Bullish Candlestick Patterns
Bullish forex candlestick patterns generate opportunities to highlight when the market will turn bullish/provide you with a potential buying opportunity.
It is great to know these patterns as you can find high probability trade ideas that appear when the market is about to go up.
Let’s start with the first bullish candlestick:
The Hammer Pattern
The hammer candlestick pattern is part of a duo that is probably one of the most taught and looked at forex candlestick patterns on the internet.
The reason behind this is that it’s a really easy pattern to spot and is equally as easy to trade.
The hammer pattern can be found at the bottom of a trend.
They usually give a signal when the downtrend has become exhausted – no more sellers in the market – and the buyers can come in and bring the price higher.
That is exactly what the hammer pattern portrays in the background (selling pressure dropping and buyers getting involved).
This can be seen because for a hammer pattern to form, the price must be taken much lower from open, creating a lower low but during the trading session, the buyers take advantage of the weakness and bring the price back up.
Thus giving a hammer sort of shape.
So once you see one of these candlesticks, you know that the momentum could be changing shortly.
The hammer pattern is a 1-bar pattern, which means that it can appear at any time and give an indication that the markets may shift.
You can clearly see one of these patterns by its long lower shadow as you can see in the image below.

Quick Action Summary of The Hammer:
It is usually found: At the end of a downtrend
Number of candlesticks to complete the pattern: 1
What type of signal is generated: Reversal
Signal strength: Strong
Final Candlestick Color: Green (or whatever you choose for bulls)
What it means in terms of momentum buyers/sellers: Current sellers are exhausted and buyers have pushed up the price – therefore more buyers in the market = higher prices. You can also try our BUY/SELL Indicator for TradingView.
The Bullish Engulfing Pattern
In the hammer pattern we saw what happened when the sellers weakened and then the buyers jumped in to push the price higher, with the bullish engulfing pattern the buyers controlled almost the entire session.
This gives you a strong indicator that the move up should have momentum behind it. Check also our Support and Resistance Indicator.
Moreover, they are easy to spot in the markets as well.
They are usually large candle bodies that have short high and low wicks, but a large body between the open and close price.
Also, this pattern is called a takeover because it takes over the close and high positions of the previous candlestick.
This pattern can be found at the end of the trend and demonstrates a drastic change in the bulls of the market.
When a bullish engulfing pattern is confirmed, it’s usually a strong signal to take advantage of a market shift.
Check out the bullish engulfing pattern below:

Quick Action Summary of the Bullish Engulfing Pattern:
Where it is usually found: At the end of a downtrend, but can appear at any point.
Number of candlesticks to complete the pattern: 2
What type of signal is generated: Reversal
Signal strength: Strong
Final Candlestick Color: Green (or whatever you choose for bulls)
What this means from a buyer/seller momentum perspective: Current sellers are non-existent and buyers have pushed the price higher than the previous candlestick high and open – therefore more buyers in the market = higher prices.
The Piercing Line Pattern
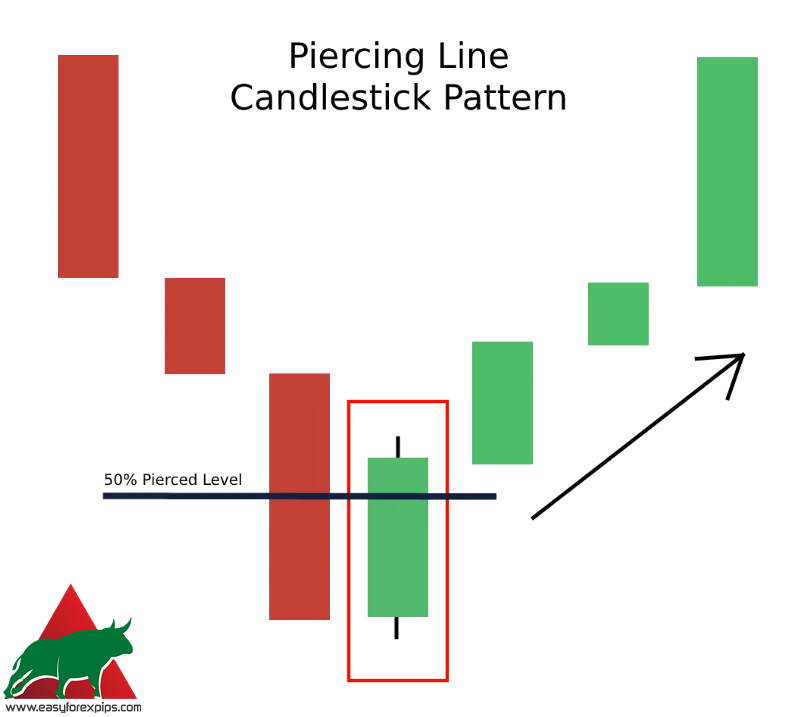
This piercing line pattern is another 2 forex candlestick patterns that generates a reversal signal.
The name is given because the signal candlestick breaks at least 50% of the previous day’s candlestick.
Unlike a bullish engulfing bar that engulfs the previous candlestick, you would like to see the sellers try to pull the price further down before the buyers overwhelm them.
Normally you would want a bullish candlestick to have a gap down, but in forex – because the market is 24 hours there are very few gaps created, in fact you will only find them (sometimes) on a daily/weekly chart.
So the next best thing is to watch if the bullish candlestick moves slightly lower before it breaks the 50% level.
Imagine pulling back on a slingshot – you have to pull back to create forward thrust. It’s the same idea.
Again, this piercing line pattern is seen towards the end of a downtrend, thus revealing a potential reversal ahead.
Let’s take a quick look at the pattern:
A quick summary of the piercing line pattern:
Where it is usually found: At the end of a downtrend, but it can appear at any point – this reduces its effectiveness.
Number of candlesticks to complete the pattern: 2
What type of signal is generated: Reversal
Signal Strength: Weak, can be used to provide confirmation and basic for future trading
Final Candlestick Color: Green (or whatever you choose for bulls)
What this means in terms of buyer/seller momentum: The current sellers tried to push the price down, but the buyers pushed it higher than the midpoint of the previous candlesticks.
You may also be interested in ours GOLD/XAUUSD Signals.
More buyers in the market = higher prices.
Another bullish forex candlestick patterns on the list is:
The Tweezer Bottom Pattern
The Tweezer Bottom candlestick pattern is a great reversal signal that traders take advantage of.
Ideally, previous lows are flat, but the open of a bearish candlestick is the same as the close of a bullish candlestick.
This forms two lower wicks of equal length, hence the name “tweezers”.
It is important to note that this is a two candlestick pattern and appears at the end of a downtrend.
What the bottom tweezers candlestick pattern tells you as a trade is that the sellers have not been able to take the price below a certain point for two trading sessions, but the buyers have been able to show up and change the momentum.
Thus, it allows you to look for buying opportunities.
Here’s what a forex candlestick patterns with a bottom tweezer looks like:

Quick Summary of Tweezer Bottom Pattern:
Where it is usually found: Usually at the end of a downtrend, but it can appear at any time – however, this reduces its effectiveness.
Number of candlesticks to complete the pattern: 2
What type of signal is generated: Reversal
Signal strength: Strong
Final Candlestick Color: Green (or whatever you choose for bulls)
What this means in terms of buyer/seller momentum: Current sellers have tried to push the price down in the same spot twice over two sessions, but buyers have appeared twice and pushed the price higher.
You may also be interested in ours Forex SIGNALS.
This shows momentum in favor of the bulls.
The Morning Doji Star Pattern
The morning doji star is a 3-candlestick pattern that can easily be overlooked, but it gives a lot of information based on the shift in power between buyers and sellers.
If you look at it that way, it tells the story of how momentum changes.
It goes from dominant sellers to neither buyers nor sellers being dominant, then showing buyers as dominant – giving you a flow of momentum.
It also tells us that the bulls were able to essentially choke the downtrend sellers out of the market for two periods, thus giving a valid bullish signal.
Because of the fairly clear visual transition from bears to bulls, this is a pretty strong indicator – and when spotted, should be heeded.
Remember that compared to many other candlestick chart patterns – this requires 3 candlesticks, which means 3 different trading sessions to generate this formation. For help check BUY/SELL INDICATOR.
Check out the 3-bar formation below:

Morning Doji Star Pattern Quick Action Summary:
Where it is usually found: At the end of a downtrend.
Number of candlesticks to complete the pattern: 3
What type of signal is generated: Reversal
Signal strength: Strong
Final candlestick color: green (or whatever you choose for bulls)
What this means in terms of buyers/sellers momentum: Downward pressure is released into neutral and then buyers take control after that.
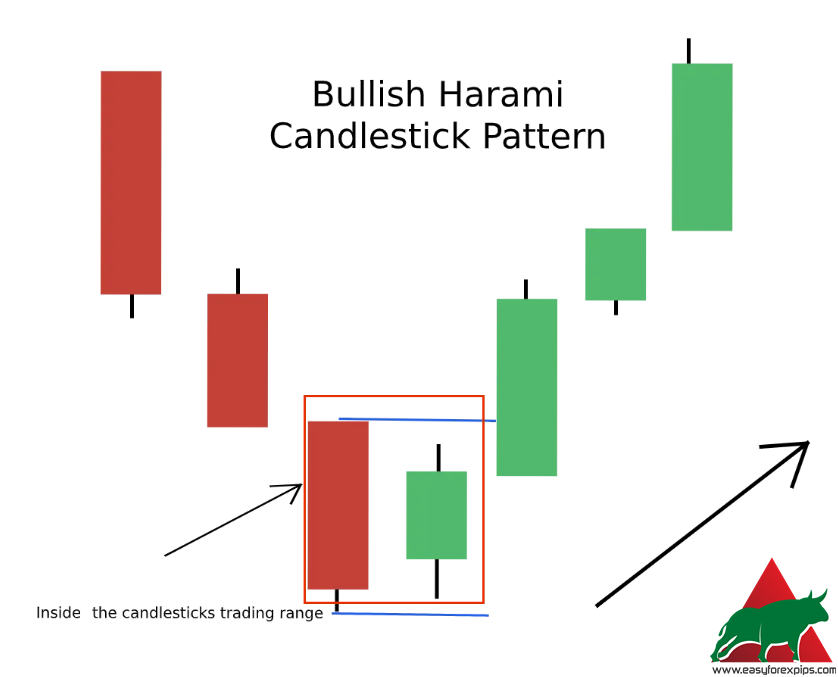
The Bullish Harami Pattern
The simplistic name of this pattern is an inner bar, which accurately describes this 2 candlestick pattern perfectly.
This forex candlestick patterns appears quite often and can be found during a trend, which means it can also happen as a continuation pattern – but they have a much better chance of success when seen at the bottom of a downtrend trend.
A bullish harami is caused when enough buyers enter the market but are unable to drive the price higher than the opening price of the previous candlesticks.
The bullish harami pattern remains within the previous high, open, close and low candlestick ranges.
This is important because it dictates that sellers cannot continue their moves down – while buyers were able to get in but lacked the buying power to push it higher.
This candlestick pattern is more of a setup candlestick that makes you aware of bullish reversals (or bullish continuations) – so spotting them can make entering and re-entering trades easy. You may be interested in SUPPORT and RESISTANCE INDICATOR.
Bullish Harami Pattern Quick Action Summary:
Where it is usually found: At the end of a downtrend or during an uptrend as a continuation pattern.
Number of candlesticks to complete the pattern: 2
What type of signal is generated: Reversal
Signal strength: Strong
Final Candlestick Color: Green (or whatever you choose for bulls)
What this means in terms of buyer/seller momentum: The pressure from sellers has given in to the bulls entering the markets, but the bulls are not strong enough to push the price higher.
With that said, the bullish harami works well with other market confluences such as supply and demand levels.
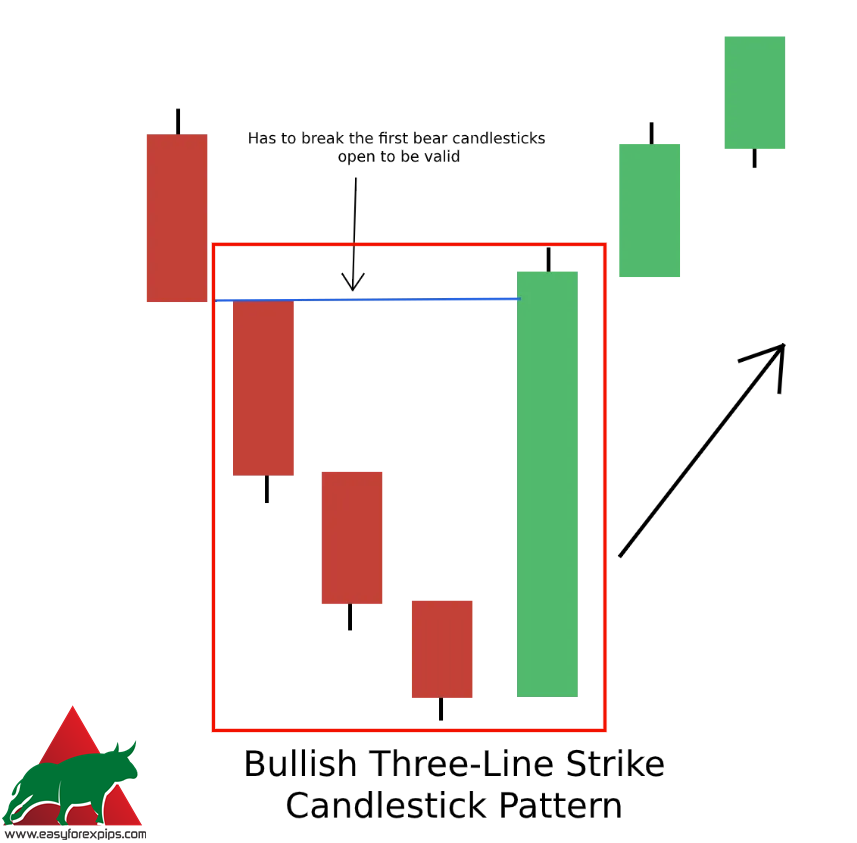
The Bullish Three-Line Strike Pattern
Not an ordinary candlestick model, but one of the best.
The only reason for its unpopularity is that it doesn’t appear too often, which is why people lose interest in looking for it.
But as Lady Mary Currie once said:
“All good things come to those who wait.”
And if you find a three-line forex candlestick patterns, you should be excited.
This pattern consists of three bearish candlesticks and a large bullish candlestick, the first three bearish candlesticks make lower lows and then the last candlestick closes higher than the first forex candlestick patterns.
It’s very simple, but the three line strike is one of the best reversal indicators. If you don’t have time to trade check our FOREX SIGNALS.
This is because we are seeing a surge of buying power entering the market that has managed to change the direction of the market by pushing the price higher and consuming all of the previous 3 candles.
You can see a three-line punch in action below:
Quick Summary of the Three-Line Strike Pattern:
Where it is usually found: At the end of a downtrend.
Number of candlesticks to complete the pattern: 4
What type of signal is generated: Reversal
Signal strength: Very strong
Final Candlestick Color: Green (or whatever you choose for bulls)
What this means from a buyer/seller momentum perspective: Sellers have been in constant control for three trading sessions, making lower lows as markets continue to fall.
Then, almost out of the blue, buyers enter the arena and obliterate the sellers, taking control and taking prices higher than the open price three forex trading sessions ago. This is how we generate our GOLD/XAUUSD SIGNALS.
The following candlestick is unique because it is from an indecisive candlestick but can be used for a bullish signal:
The Dragonfly Doji Pattern
Dragonfly doji is a type of indecision candle that can form at the bottom of a downtrend.
They are very similar to the Hammer pattern discussed earlier, but the only difference is that there is no candle body on the chart.
The opening price is the same as the closing price.
This means that during the trading sessions, the bears were able to pull the price down, generating a session bottom, after which it aggressively moved back up, caused by the bull rush.
However, the balance of power between the bulls and bears is equal – thus creating a dragonfly doji.

Dragonfly Doji Pattern Quick Action Summary:
Where it is usually found: At the end of a downtrend.
Number of candlesticks to complete the pattern: 1
What type of signal is generated: Reversal
Signal strength: Average
Final color of the candlestick: black – but can also be shown as green/red.
What it means in terms of buyer/seller momentum: Buyers have been able to enter the market and overwhelm the sellers, therefore changing the momentum – but the close price is the same as the open price – so you will have to wait for further confirmation of a reversal.
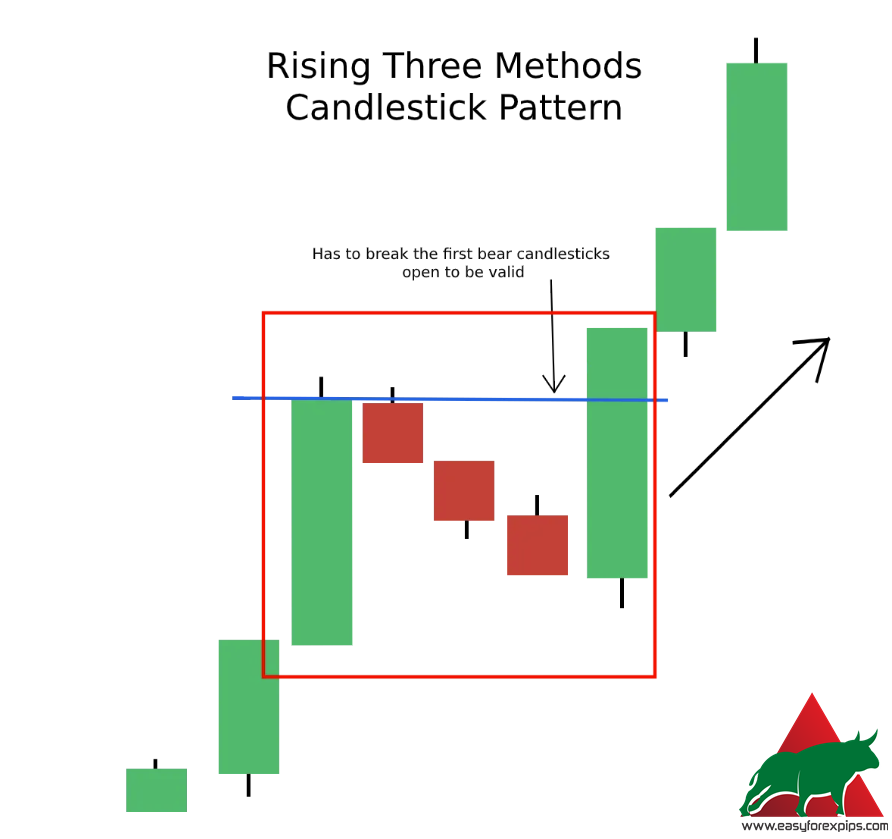
The Rising Three Method Pattern
The rising three method pattern is usually found in a bullish uptrend and is a continuation pattern.
This particular pattern is also 5 candlesticks long. Copy Telegram signals to MT4 Platform Software.
What we are looking for is a large bullish candlestick followed quickly by 3 smaller candlesticks trading slightly lower and close between the high and low range of the large bullish candlestick.
The last candlestick is a large bullish candlestick that closes above the close of the first bullish candlestick.
This occurs when buyers in the markets require some rest before taking the market higher.
This tells us that in the current uptrend, the sellers pushing the price down are weak and will be easily defeated when the buyers re-enter.
There’s a lot to look at, but this image below will help explain:
Summary of the Quick Actions of the Rising Three Method Pattern:
Where it is usually found: At during an uptrend.
Number of candlesticks to complete the pattern: 5
What type of signal is generated: Continued
Signal strength: Strong
Final candlestick color: green.
What it means from a buyer/seller momentum perspective: Buyers are still in control of price and momentum in the current uptrend, sellers are trying to re-enter but are too weak, thus generating more upside once buyers regain their momentum and take a higher price.
The Bullish Hikkake Pattern
This forex candlestick patterns is one of our favorites.
It is essentially a fake breakout pattern for a Harami pattern.
The setup is quite advanced compared to other candlestick charts, but it provides a great setup for a buy trade.
You may also be interested in ours Telegram to MT4 Copier software.
This is a 3-5 candle formation that we can take advantage of.
It starts with a normal bullish Harami, after which the next candlestick should produce a lower high and a lower low.
This is the 3 bar setting.
Now within the next two trading periods you want to see a bullish candlestick rise and close above the Harami high.
This will give you confirmation that a bullish Hikkake has formed and that a strong move may occur to continue the uptrend.
Let’s break it down in the image below:

Hikkake Bullish Pattern Quick Action Summary:
Where it is usually found: At the end of a downtrend.
Number of candlesticks to complete the pattern: 3-5
What type of signal is generated: Reversal
Signal strength: Strong
Final candlestick color: green.
What it means in terms of momentum buyers/sellers: There is a false breakout from the harami pattern and a pause from the sellers, allowing buyers to take control and push the price up quickly.
The Three White Soldiers Pattern
Some forex candlestick patterns on the market require extra detail and attention, and the Three White Soldiers pattern is one of them.
The reason is that they have a certain setting that makes them work, anything else makes them fail.
In addition to that, at a glance – this pattern just looks like 3 candlesticks going up.
Fear not as we will show you the real model to look out for.
This pattern identifies a reversal of the current uptrend and is caused by a huge influx of buyers entering the market at a certain level/price.
The three white soldiers pattern is formed after a big push down by the sellers (this is key).
If you see three bullish candles in a row, but do not follow a previous bearish spike – then these are exactly three bullish candles, not the pattern we are looking for.
The first bar in the three white soldiers pattern should then close at between 50-60% of the previous bearish candlestick.
The second candlestick should close higher than the bearish candlestick.
While the last candlestick should continue higher, which is similar in size to the middle candlestick, but should open (or make a small top) on the close of a bearish candlestick.
In addition to this rule, each candlestick should create new higher highs and close near those highs. You may be interested in GOLD/XAUUSD Signals.
Let’s show an example:
Let’s break it down in the image below:

Quick Action Summary of the Three White Soldiers model:
Where it is usually found: At the end of a downtrend and after a large, volatile push.
Number of candlesticks to complete the pattern: 3
What type of signal is generated: Reversal
Signal Strength: V. Strong
Final Candlestick Color: Green (or whatever you choose for bulls)
What this means from a buyer/seller momentum perspective: Current sellers quickly pushed prices too aggressively and lost strength/hit a buy order streak. Buyers take advantage and charge a higher price.
This is also a combination of taking profit from big moves.
Bearish Candlestick Patterns
Some of the easiest to recognize and learn candlestick patterns, that are proven to change the markets from an uptrend to the start of a downtrend.
By learning this section, you will be able to instantly analyze what is in front of you and be ready to adapt to the situation accordingly.
Without further ado, let’s start with the first bearish candlestick pattern:
The Shooting Star Pattern
The beauty of reversal patterns is that they have a counter-pattern that is the same setup but goes the other way and turns on its head.
In this case, a shooting star is the same as a hammer – but upside down, so in this case we are looking for the market to reverse.
This 1 bar pattern was generated when buyers tried to push the price much higher but failed and sellers entered the market aggressively.
Pushing the price back to almost the open price and thus generating a long upper shadow.
You may also be interested in ours Support and Resistance Indicator.

Shooting Star Pattern Quick Action Summary:
Where it is usually found: At the end of an uptrend.
Number of candlesticks to complete the pattern: 1
What type of signal is generated: Reversal
Signal strength: Strong
Final candlestick color: red (or whatever you choose for bears), but can also be green.
What it means in terms of momentum buyers/sellers: The buyers were defeated and lost control of the sellers. Momentum is now shifting in favor of sellers.
The Bearish Engulfing Pattern
Just like the shooting star, the swallow pattern can go both ways – so it makes it much easier to learn!
Just like the bullish takeover pattern, this is a 2-bar pattern that occurs when the tide changes quickly and suddenly from buyers in control to sellers in charge.
You want to make sure that the bearish engulfing pattern closes below the opening price of the previous candlesticks. SUPPORT AND RESISTANCE INDICATOR.
Naturally, this pattern shows that the markets want to move down and break away from the previous uptrend.

Summary of the bearish engulfing pattern’s quick actions:
Where it is usually found: At the end of an uptrend, but can appear at any time.
Number of candlesticks to complete the pattern: 2
What type of signal is generated: Reversal
Signal strength: Strong
Final candlestick color: Red (Or whatever you choose for bears)
What this means from a buyer/seller momentum perspective: Current buyers have weakened due to the uptrend and sellers have pushed the price lower than the previous candlestick low and open – therefore more sellers in the market = lower prices.
The Tweezer Tops Pattern
The Tweezer Tops candlestick pattern is a strong reversal indicator that is easy to spot.
They are formed when the price has been rejected twice over two trading sessions – ideally the previous highs are equal, but the opening of a bullish candlestick is the same as the close of a bearish candlestick.
This forms two taller wicks of equal length, this is very important.
What the pinch top formation tells you as a currency trader is that the buyers have not been able to take the price higher than a specific price for two trading sessions, but the sellers have been able to come in and change the momentum.
You may also be interested in ours BUY/SELL Indicator.
Thus, it allows you to look for sales opportunities.

A quick summary of the tweezer tip pattern:
Where it is usually found: At the end of an uptrend, but it can appear at any point – this reduces its effectiveness.
Number of candlesticks to complete the pattern: 2
What type of signal is generated: Reversal
Signal strength: Strong
Final candlestick color: Red (Or whatever you choose for bulls)
What this means in terms of buyer/seller momentum: Current buyers have tried to push the price to the same price twice in two sessions, but sellers have appeared twice and pushed the price down.
This shows momentum in favor of the bears.
The Three Black Crows Pattern
A lot of people learn this by generalizing the rules a bit, which isn’t great because you’ll have a hit or miss pattern. Not what you want.
The three black ravens pattern formed after a big push up by buyers (this is key).
If you see three bearish candles in a row, but you don’t follow a previous bullish spike – then those are exactly three bearish candles, not the pattern we expect.
Don’t worry, an image will follow soon to help you visualize this.
The first bar in the three black crows pattern should then close between 50-60% of the previous bullish candlestick.
The second candlestick should close lower than the bullish candlestick.
While the last candlestick should continue lower, which is similar in size to the middle candlestick.
It should open (or make a small top) on the close of the bullish candlestick. Checkout our FOREX SIGNALS.
In addition to this rule, each candlestick should make new lower lows and close near those lows.

Quick Summary of the Three Black Crows Pattern:
Where it is usually found: At the end of an uptrend and after a large, volatile push.
Number of candlesticks to complete the pattern: 3
What type of signal is generated: Reversal
Signal Strength: V. Strong
Final candlestick color: red (or whatever you choose for bears)
What it means from a buyer/seller momentum perspective: Current buyers quickly pushed prices up too aggressively and lost strength/hit a run of sell orders.
Sellers take advantage and charge the price lower.
This is also a combination of taking profit from big moves.
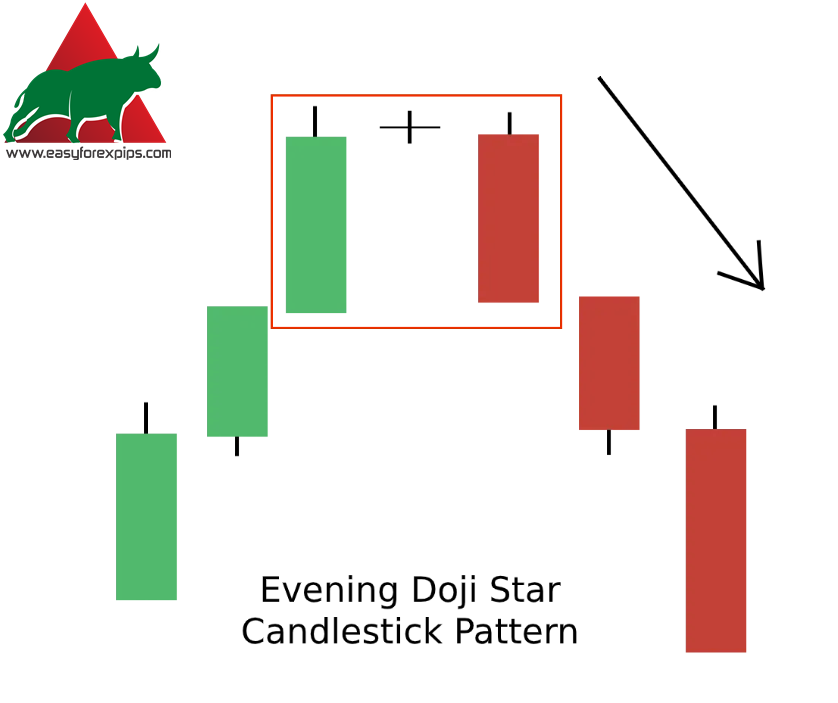
The Evening Doji Star Pattern
The opposite of the uptrend is the downtrend, and the opposite of the Morning Star is the Doji Evening Star pattern.
This pattern is the same but appears at the end of an uptrend with the same, easy to identify pattern.
The key thing that remains is that the middle candlestick should be small relative to the candlesticks on either side.
Ideally around 10% of the ranges, but with the Evening Star models less is more.
What this pattern tells you as a trader is that after the market had been pushed up for a while by the bulls, they started to show signs of exhaustion (the first two candles) and the bears were able to come in and take the price low.
You may also be interested in ours Telegram to MT4 copier software.
Evening Star Model Quick Action Summary:
Where it is usually found: At the end of an uptrend and after a big one.
Number of candlesticks to complete the pattern: 3
What type of signal is generated: Reversal
Signal strength: Strong
Final candlestick color: red (or whatever you choose for bears)
What this means in terms of buyer/seller momentum: Buyers are exhausted from continuing the uptrend for some time.
The first sign of bears entering the market is the second candlestick that barely goes up or down.
It is then followed by a bearish candlestick, confirming that the sellers have momentum and a potential reversal is imminent.
Don’t forget to check out our FOREX SIGNALS.
The Bearish Harami Pattern
The bearish harami pattern is the opposite of the bullish 2 candlestick pattern.
This candlestick formation is caused after sellers enter the market and outperform buyers, but are not strong enough to close the price lower to confirm the momentum change.
The bearish harami pattern remains within the previous high, open, close and low range of the candlesticks.
This is important because it dictates that buyers cannot continue their upward moves – while sellers were able to get in but lacked the selling power to take it lower.

Quick Action Summary of the Bearish Harami Pattern:
Where it is usually found: At the end of an uptrend or during a downtrend as a continuation pattern.
Number of candlesticks to complete the pattern: 2
What type of signal is generated: Reverse/Continue
Signal strength: Strong
Final candlestick color: Red (Or whatever you choose for bulls)
What this means from a buyer/seller momentum perspective: The pressure from the buyers is exhausted until the bears enter the markets, but the bears are not yet strong enough to push the price down. GOLD/XAUUSD SIGNALS.
The Gravestone Doji Pattern
The doji family has funny names, but they are very accurate.
Tombstone dojis are no joke either – if they are spotted at the top of an uptrend, it usually means the trend is dead!
This gives you a great opportunity to take a contrarian position.
A tombstone doji is formed when bulls try to extend the uptrend to the upside, but fail and quickly encounter a barrier of sellers.
This creates the long wicks that look similar to the Shooting Star model. You may be interested in Support and Resistance Indicator.
When the uptrend meets a wall of stationary sell orders, the price falls down to the opening price. If the price closes at the same level as the open, then we have a tombstone doji!

Gravestone Doji Pattern Quick Action Summary:
Where it is usually found: At the end of an uptrend.
Number of candlesticks to complete the pattern: 1
What type of signal is generated: Reversal
Signal strength: Average
Final color of the candlestick: black – but can also be shown as green/red.
What this means in terms of buyer/seller momentum: Sellers have been able to enter the market and overtake buyers, thereby transferring momentum – but the close price is the same as the open price. Check also our GOLD/XAUUSD signals.
So you will have to wait for further confirmation of a bearish reversal.
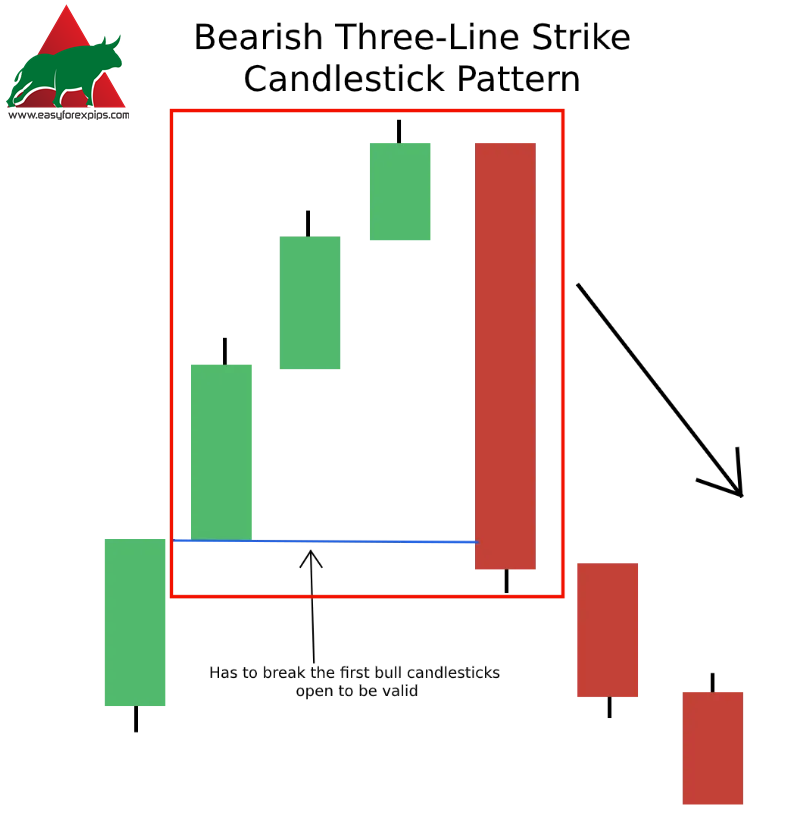
The Bearish Three-Line Strike Pattern
The family of three-line candlestick patterns are powerful reversal patterns – so you should definitely learn them.
The bearish three-line strike pattern consists of three bullish candlesticks and a large bearish candlestick.
The first three bullish candlesticks make higher highs and the last candlestick closes lower than the first candlestick pattern.
This happens in the markets because we see a surge of selling power entering the market that has managed to manipulate the direction of the market by pushing the price down and engulfing all of the previous 3 candles.
You can see a three-line bear strike in action below:
Quick Action Summary of Bearish Three Line Strike Pattern:
Where it is usually found: At the end of an uptrend.
Number of candlesticks to complete the pattern: 4
What type of signal is generated: Reversal
Signal strength: Very strong
Final candlestick color: Red (Or whatever you choose for bulls)
What this means in terms of buyer/seller momentum: Buyers have been in constant control for three trading sessions, hitting higher highs as markets continue to rise.
A wave of sellers then entered the markets and dominated the buyers, taking control and taking prices lower than the opening price three trading sessions ago. You may be interested in BUY/SELL INDICATOR.
Which candlestick pattern is most reliable?
That’s the million dollar question
Below is the list of candlestick patterns (from top) in order that we think are the best to trade.
Please note that this is not advice.
You may have more success with other patterns instead, so it’s a great idea to learn them all.
The answers below will be for both bullish and bearish patterns (unless stated).
- The three-line shock pattern
- Three Black Ravens / Three White Soldiers
- Absorbing bar
- Hikake Pater
- Rising/falling three methods
- Morning/Evening Doji Star
- Hammer/Shooting Star
- Harami model
- Dragonfly/Gravestone Doji
The list is not definitive, but in our experience – we have seen fewer false signals with the triple strike patterns than with the Dragonfly/Gravestone Dojis.
Either way, go through them all and learn from each one – as each presents a strong signal of an opportunity emerging in the markets.
You may be interested in Forex Signals.