
Support and Resistance Trading Strategies
Support and resistance are some of the basic trading strategies of the Forex market. Proper drawing of these levels is the key to increasing the number of winning trades.
There are a lot of strategies for trading in the Forex market.
Some of them are considered to be complicated, so they are mainly used by professional traders. However, there are relatively simple strategies that are good for beginners and for more sophisticated market participants as well. For example, simple strategies may include trading using support and resistance levels.
In this article, we’ll:
- Consider the most popular trading strategies using support and resistance levels;
- Take a look at real examples illustrating each strategy;
- Give you valuable tips on how to trade using support and resistance strategies.
Before we begin, make sure you have installed the Support&Resistance indicator, since it will be used in all the examples.
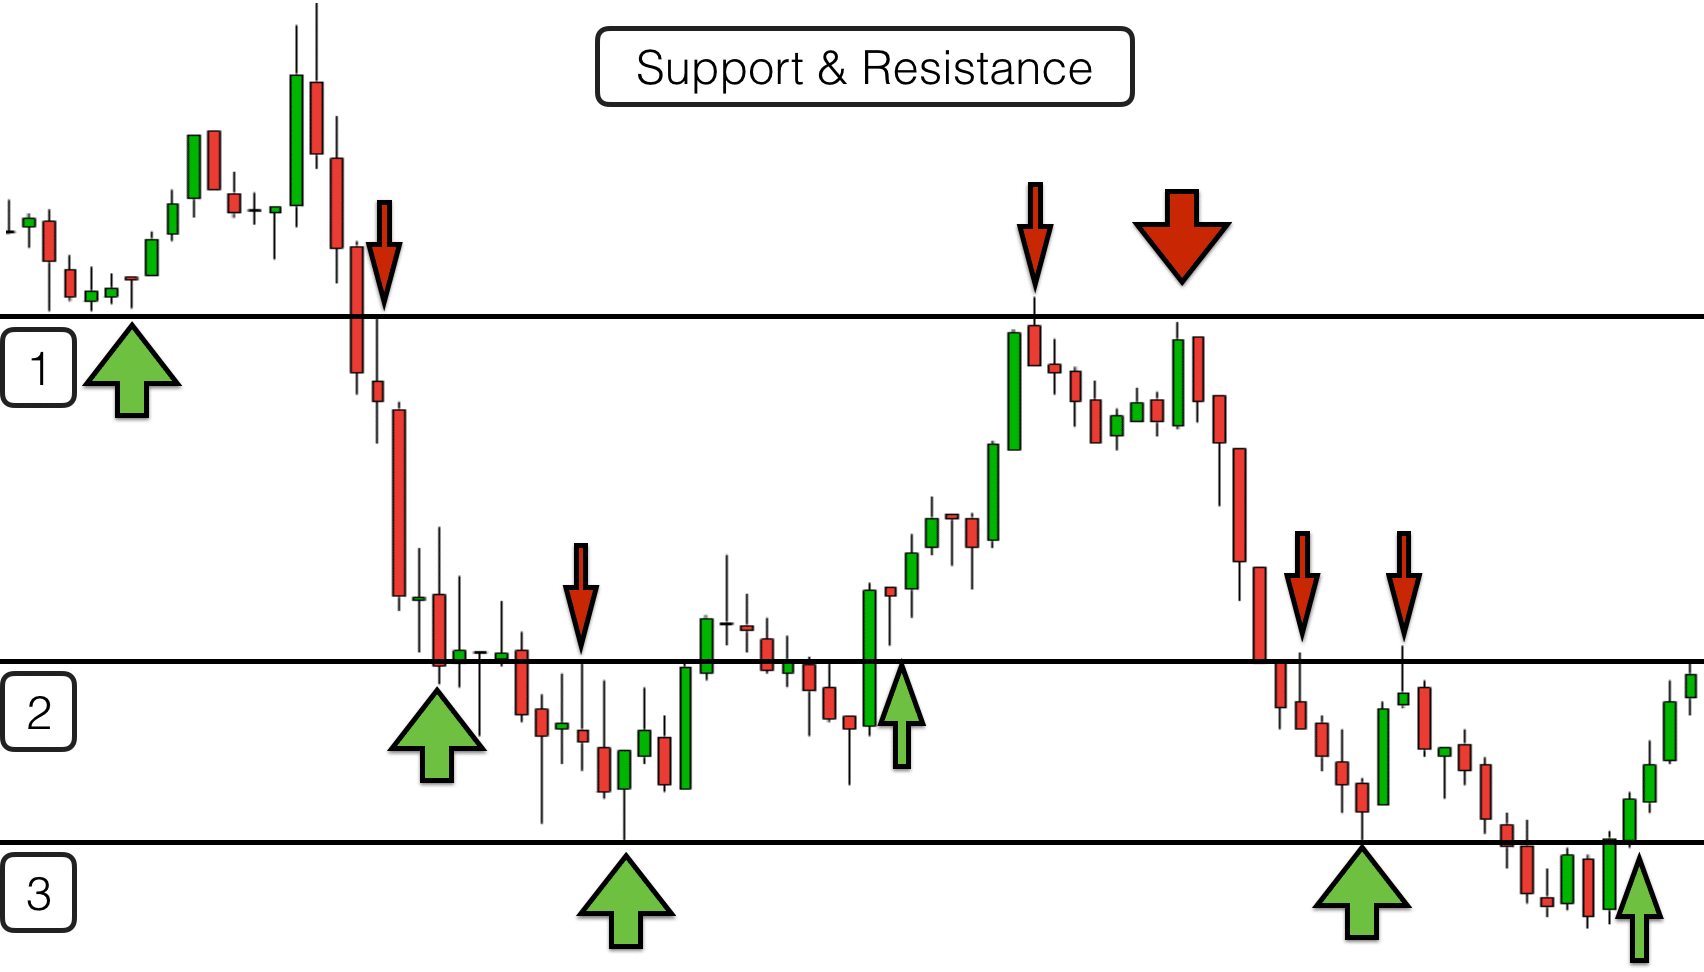
Please also note that levels in this article are referred to not as strictly drawn horizontal lines, but as some significant areas that the price interacts with.
Support/Resistance Breakout Strategies
This strategy is one of the best for trading during trend moves. As a rule, the more clearly defined the uptrend or downtrend, the more opportunities for winning trades. You may also be interested in ours GOLD/XAUUSD Signals.
The “support/resistance breakout” strategy involves the following steps:
- Identifying the price movement direction. If there is an uptrend, we should expect a resistance breakout. If there is a downtrend, we should expect a support breakout.
- As soon as the price makes a real break through the target level, we open a trade: in case of a resistance breakout, we buy a currency pair; in case of a support breakout, we sell it.
- Stop Loss is usually placed above the broken out support and below the broken out resistance. The distance between the level not respected by the price and Stop order should slightly exceed the average volatility of a currency pair.
- We should take the profit as soon as the price shows signs of an incipient retracement. Quite often, the price reverts back to the broken level, which can completely wipe out the potential profit.
Let’s take a look at the examples where this strategy can be applied. If you don’t have time to trade you can check our SIGNALS PRODCUTS HERE.
Support Breakout
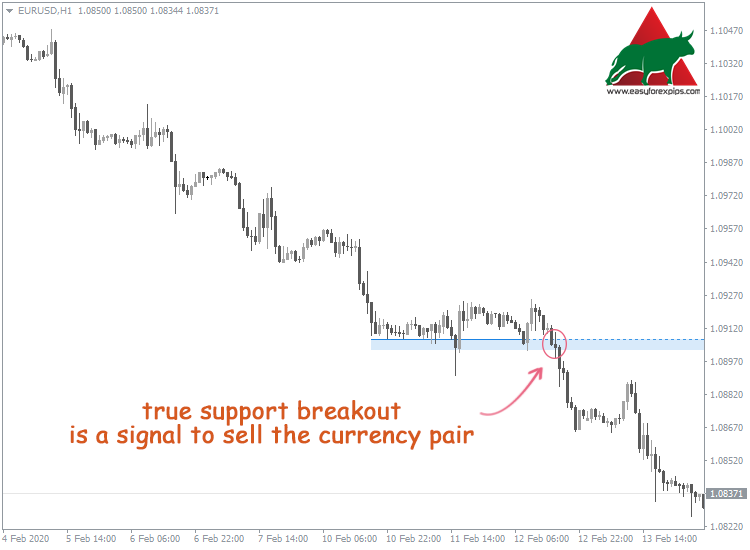
The EUR/USD forex pair is indicating a downtrend. The image below shows how it breaks the next support levels.
As soon as the bearish candlestick closes below the broken level, you can sell.
Resistance Breakout
In this example, the price of the USD/JPY currency pair overcomes the resistance level. As soon as the bullish candlestick closes above the resistance zone, it may be regarded as the level breakout. Such a situation is favorable for buying.

The advantage of the “support/resistance breakout” strategy is that it allows you to use strong price movements. Thus, the risk of losing a potential profit is minimal.
On the other hand, there is always a chance of a false breakout. In this case, the price may revert back to the previous trading range and trigger Stop Loss. So before entering a trade, it’s recommended to pay attention to additional signals confirming that the breakout is real. You may also be interested in ours Forex SIGNALS.
Support/Resistance Retest Strategies
Retest strategy also works well for trend movements. The task of a trader is once again to wait for the true breakout of support or resistance level. For help check BUY/SELL INDICATOR.
The feature of the “support/resistance retest” strategy is that we don’t open the trade immediately after the level breakout. Buy or Sell trades should be made only after the price reverses, tests the broken level, and heads in the initial direction again.
Below, you can see the examples illustrating the above mentioned strategy.
Support Retest
The image shows the EUR/USD currency pair price breaking the support level. After a while, it retests the broken level. Then, the price bounces from the level, failing to break it again. Such a situation is favorable for selling.
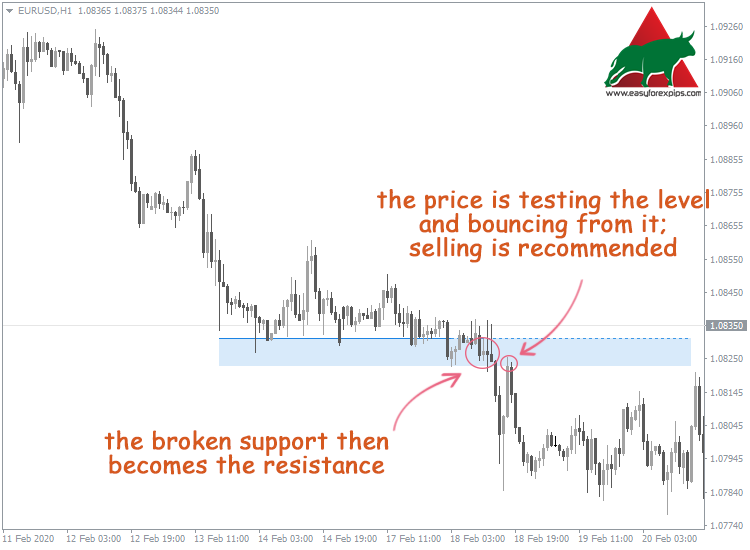
We can see an example of how resistance turns into support. Such a development can be observed quite often and indicates the significance of the broken level.
Pretty often, the price retests the broken levels two, three or even more times. Each time the price touches a level, it’s considered to be a good possibility to enter a trade.
Resistance Retest
Example in the image below: This is how we generate our GOLD/XAUUSD SIGNALS.
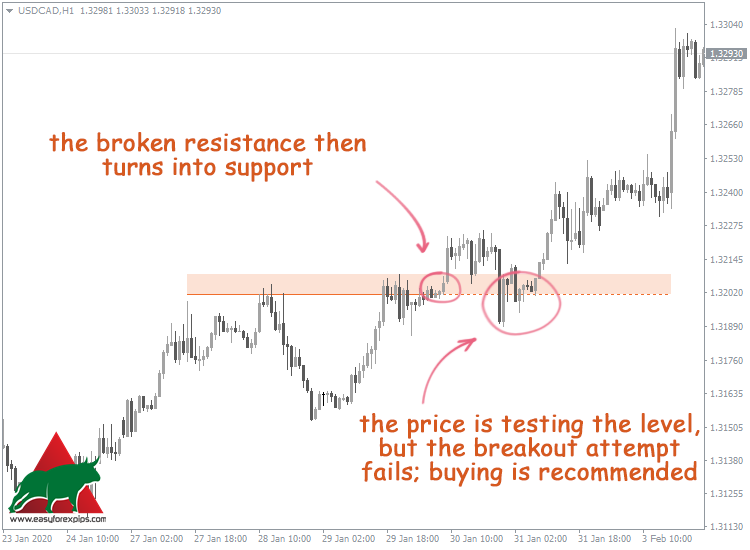
USD/CAD currency pair price indicates an upward movement.
After the resistance level has been broken, the price continues to go higher, but then it enters a retracement stage and retests the broken level. We can see the bounce, after which the resistance becomes the support.
It’s recommended to buy a currency pair if the price has retested the level and left the zone.
Bounce From Support and Resistance Within the Horizontal Range Strategy
This strategy works well when trading within horizontal price ranges.
Such ranges form when the price is traded between two levels, one of which serves as support, and the other one as resistance. Repeatedly bouncing from one to another, the price can stay in the range for a relatively long time.
It’s reasonable to assume that soon enough, touching the upper border of the range will be a good reason for selling the currency pair, and touching the lower one will be favorable for buying. Copy Telegram signals to MT4 Platform Software.
Let’s take the trading range formed by the AUD/USD currency pair as an example.

As long as the price stays in the support or the resistance area, opening a trade is not recommended. This is due to the risk that the price may break through the level and continue its movement beyond the horizontal range.
It is better to make trades only when the price bounces from support or resistance levels.
The zone between support and resistance levels is divided into 3-4 price areas. Their number depends on the range height and features of the chart. In this example, the trading range is divided into three areas:
- Buying is recommended in the zone closest to the support level, and selling is suggested to be in the area closest to the resistance level.
- While the price stays in the middle area, making trades is not recommended.
- Stop orders should be placed outside the boundaries of the trading range, namely, above support and below resistance levels. As with the examples above, the distance from Stop Loss to the corresponding level should slightly exceed the average volatility of a currency pair.
Don’t consider range borders as something permanent. Over time, the price may start to move slightly beyond the range, subsequently returning. The opposite situation is also a possibility – when the price stops reaching support or resistance areas.
Therefore, you need to adjust the trading range from time to time.
Make sure you have installed the Support&Resistance indicator, since it will be used in all the examples.